Graphically depicting Frasier ratings by season (ggplot2 and R)
{Frasier spoilers ahead...}
Recently I've been re-watching Frasier, one of the greatest TV shows of all time (in my biased opinion). I've always been curious about whether the oft-repeated trope that Daphne and Niles getting together "ruined" the show, and I realized that I was generally curious about the statistical quality of each season (when looking at the ratings provided by IMDB). As usual, I decided to do some ggplot workings to create a graph (code at the bottom of the post):
Overall, we can see that Frasier stayed pretty steady up until Season 6. According to the smoothing line, the slip in ratings for Frasier actually happened pre Daphne and Niles, though the seasons following their romance certainly appear to represent a significant dip, followed by Frasier ending strong.
Finally, if we look at the straight averages of the IMDB ratings, the best season of Frasier was Season 4 (8.26), and the worst was Season 9 (7.66), which I'd agree is a fair assessment.
Recently I've been re-watching Frasier, one of the greatest TV shows of all time (in my biased opinion). I've always been curious about whether the oft-repeated trope that Daphne and Niles getting together "ruined" the show, and I realized that I was generally curious about the statistical quality of each season (when looking at the ratings provided by IMDB). As usual, I decided to do some ggplot workings to create a graph (code at the bottom of the post):
In this first figure I've added in some quick and dirty linear regression lines. I played around with local regression lines, but they all looked a little squirly for what I wanted to show. I really just want to present a general idea of what each season of Frasier looked like in its ratings. I also indicated the highest-rated and lowest-rated Frasier episodes ("The Ski Lodge" and "Freudian Sleep", respectively).
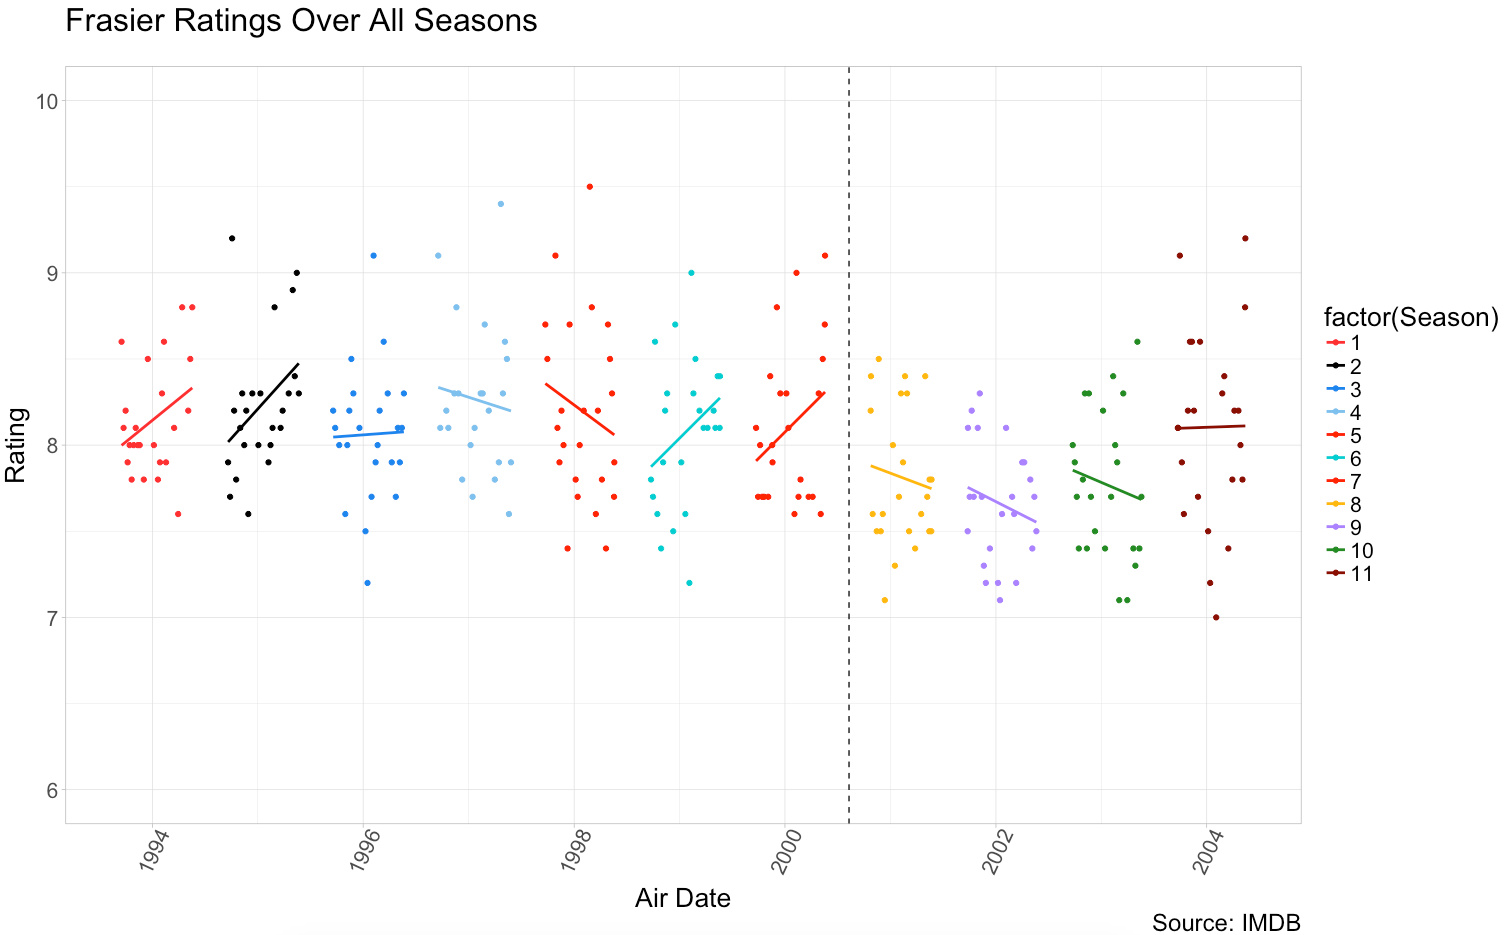
There are a few things I find interesting here. One is that the middle seasons appear to have more variability than the early and the later seasons. This is especially apparent if we look at Seasons 8, 9 & 10, which are grouped much more closely together. The other is that only four seasons, according to the ratings and the slap-dash linear regression line R put on, got better as the season went on. The other 7 either appeared to change hardly at all, or to actually decrease in quality as the season went on.
But how about Daphne and Niles? Did their getting together have a perceivable effect on the ratings of Frasier?
In this next figure, I've added a line indicating the break showing pre Daphne and Niles getting together, versus post. With that line there, we can visually see that the following three seasons appeared to be lower in ratings than the first 7 seasons. Additionally, as mentioned previously, there also appears to be less variability in those seasons. When I analyzed the data, I found that the average pre Daphne & Niles was 8.2. Post Daphne & Niles the ratings dropped to an average of 7.8. This was also statistically significant, with a p-value of 0.00000006.
How did Frasier do overall?
Overall, we can see that Frasier stayed pretty steady up until Season 6. According to the smoothing line, the slip in ratings for Frasier actually happened pre Daphne and Niles, though the seasons following their romance certainly appear to represent a significant dip, followed by Frasier ending strong.
Finally, if we look at the straight averages of the IMDB ratings, the best season of Frasier was Season 4 (8.26), and the worst was Season 9 (7.66), which I'd agree is a fair assessment.
(Niles, reacting to my rough statistical workings)


Comments
Post a Comment